Looker Studio vs Google Analytics: Do You Need Both?
Looker Studio and Google Analytics are both free Google tools that deal with data. But they are not alternatives to each other — they do completely different things. Google Analytics collects data. Looker Studio visualizes it.
The confusion is understandable. Both have charts. Both show traffic numbers. Both live in the Google ecosystem. But choosing between them is like choosing between a camera and a photo editor — you probably need both, and this guide explains exactly when to use each one and where each falls short.
What Google Analytics (GA4) Actually Does
Google Analytics 4 is a data collection and analysis platform. It tracks what users do on your website and app — page views, clicks, conversions, scroll depth, video plays, and hundreds of other events. It is the source of truth for user behavior data.
Core Capabilities
- Event-based tracking. GA4 tracks everything as events. Page views, button clicks, form submissions, purchases, file downloads — all events with parameters. This replaced the old session-based model from Universal Analytics.
- Cross-platform tracking. Track users across your website, iOS app, and Android app in a single property. GA4 stitches sessions together using User-ID and Google signals.
- Explorations. Advanced analysis tools built into GA4 — funnel exploration, path exploration, segment overlap, cohort analysis, and free-form exploration. These go far deeper than the standard reports.
- Predictive metrics. Machine learning models that predict purchase probability, churn probability, and predicted revenue for user segments.
- Real-time monitoring. See active users, events, and conversions as they happen.
- Audiences and integrations. Build audiences based on behavior and push them to Google Ads for remarketing. Native integrations with Google Ads, Search Console, BigQuery, and Google Tag Manager.
- BigQuery export. Push raw event-level data to BigQuery for SQL analysis. This is how power users unlock GA4's full potential.
Limitations
- Built-in reports are rigid. The standard reports (Acquisition, Engagement, Monetization) cannot be customized beyond adding comparisons and filters. You cannot rearrange the layout or combine metrics from different report sections.
- Explorations are powerful but single-use. Each exploration is a standalone analysis. You cannot combine multiple explorations into a unified dashboard for stakeholders.
- Data retention limits. GA4 retains user-level data for a maximum of 14 months (or 2 months on the default setting). Historical analysis beyond that window requires BigQuery export.
- Sampling. Large date ranges or complex segments trigger data sampling, which means GA4 estimates numbers rather than counting exactly. This gets worse as your traffic grows.
- Not designed for sharing. GA4 reports cannot be easily shared with stakeholders who do not have GA4 access. There is no simple "send this dashboard as a PDF every Monday" feature.
What Looker Studio Actually Does
Looker Studio is a data visualization and reporting tool. It does not collect any data on its own. Instead, it connects to data sources — including GA4 — and lets you build interactive dashboards with drag-and-drop charts, tables, scorecards, and filters.
Core Capabilities
- Visual dashboard builder. Drag charts, tables, and scorecards onto a canvas. Customize colors, fonts, layouts, and filters. Build exactly the dashboard your stakeholders want to see.
- 1,000+ data connectors. GA4 is one source. Looker Studio also connects to Google Ads, Search Console, Google Sheets, BigQuery, Facebook Ads, HubSpot, Salesforce, Shopify, and hundreds more via partner connectors.
- Data blending. Combine data from up to 5 sources in a single report. Put GA4 traffic data next to Google Ads spend and HubSpot lead data in one dashboard.
- Calculated fields. Create custom metrics and dimensions within reports — conversion rates, ROAS, custom segments, conditional formatting.
- Scheduled delivery. Send dashboard snapshots via email on a recurring schedule (1 schedule on free, 200 on Pro).
- Real-time collaboration. Multiple people can edit the same dashboard simultaneously. Share via link, embed in websites, or export as PDF.
- Templates. Pre-built dashboard templates for GA4, Google Ads, Search Console, and other common use cases to speed up setup.
Limitations
- No data collection. Looker Studio cannot track anything. It only visualizes data that exists in connected sources.
- Limited data transformation. No ETL capabilities. Data blending is basic (max 5 sources, JOIN only, no UNION).
- Performance issues. Large datasets and complex blends slow reports down significantly.
- No advanced analytics. No predictive models, no statistical analysis, no machine learning. It shows what the data says — it does not analyze why.
- Governance gaps. Basic permissions, no row-level security, no version control, no audit logs.
When to Use GA4 vs Looker Studio
Scenario: Track website/app user behavior · Use GA4: Yes · Use Looker Studio: No (it cannot collect data)
Scenario: Deep-dive funnel analysis · Use GA4: Yes (Explorations) · Use Looker Studio: Limited
Scenario: Build a branded dashboard for the CMO · Use GA4: No · Use Looker Studio: Yes
Scenario: Combine GA4 + Google Ads + HubSpot in one view · Use GA4: No · Use Looker Studio: Yes (data blending)
Scenario: Set up remarketing audiences · Use GA4: Yes · Use Looker Studio: No
Scenario: Schedule weekly report emails · Use GA4: No · Use Looker Studio: Yes
Scenario: Predict which users will convert · Use GA4: Yes (predictive metrics) · Use Looker Studio: No
Scenario: Analyze raw event data with SQL · Use GA4: Yes (BigQuery export) · Use Looker Studio: Partially (BigQuery connector)
Scenario: Share interactive reports with clients · Use GA4: Difficult · Use Looker Studio: Yes (link sharing, embedding)
The Short Answer: Use Both
For most marketing teams, the answer is not "either/or" — it is both:
- GA4 collects and stores your website and app data
- Looker Studio visualizes and shares that data alongside data from other sources
GA4 is your data collection engine. Looker Studio is your reporting layer. GA4 tells you what happened. Looker Studio helps you communicate what it means to people who will never log into GA4.
The typical workflow:
- GA4 tracks events and conversions → Looker Studio pulls GA4 data via native connector → Dashboard combines GA4 with Google Ads spend and CRM data → Scheduled email sends the dashboard to stakeholders every Monday
Where Both Fall Short
Even using GA4 and Looker Studio together, you hit common frustrations:
- Manual dashboard building. Every chart, filter, and calculated field in Looker Studio must be built and maintained by hand. When metrics change or new data sources are added, someone has to update every affected report.
- 5-source blending limit. If you need GA4 + Google Ads + Meta Ads + HubSpot + Shopify + Stripe in one view, Looker Studio cannot blend all six. You need workarounds like BigQuery staging tables.
- No cross-tool intelligence. Neither tool tells you what to do with the data. They show you numbers, but deriving insights is still your job.
- Maintenance overhead. GA4 needs ongoing event configuration, consent mode management, and BigQuery export monitoring. Looker Studio dashboards need connector upkeep and layout refreshes as business questions evolve.
Skip the Manual Work — Try Graphed
If you are spending hours every week pulling data from GA4, building Looker Studio dashboards, and manually combining sources to answer recurring business questions, there is a faster path.
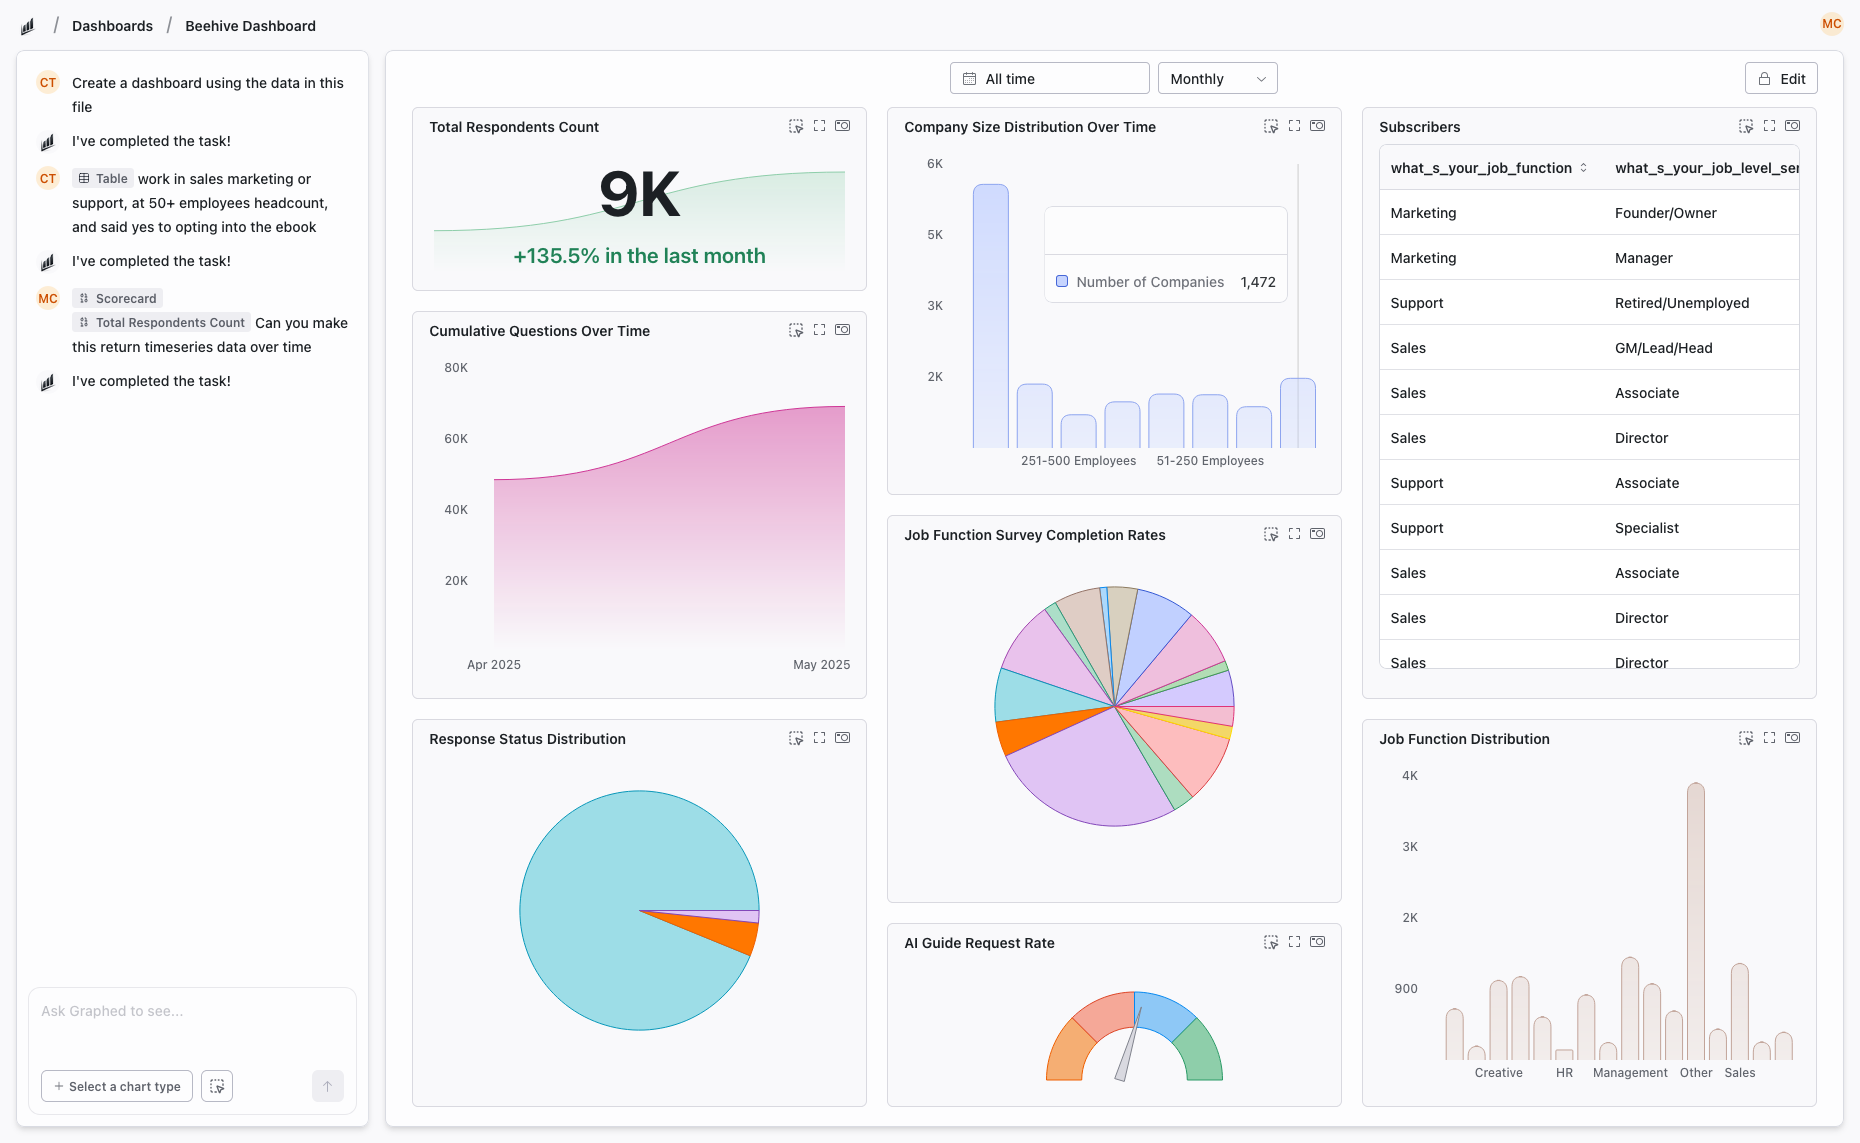
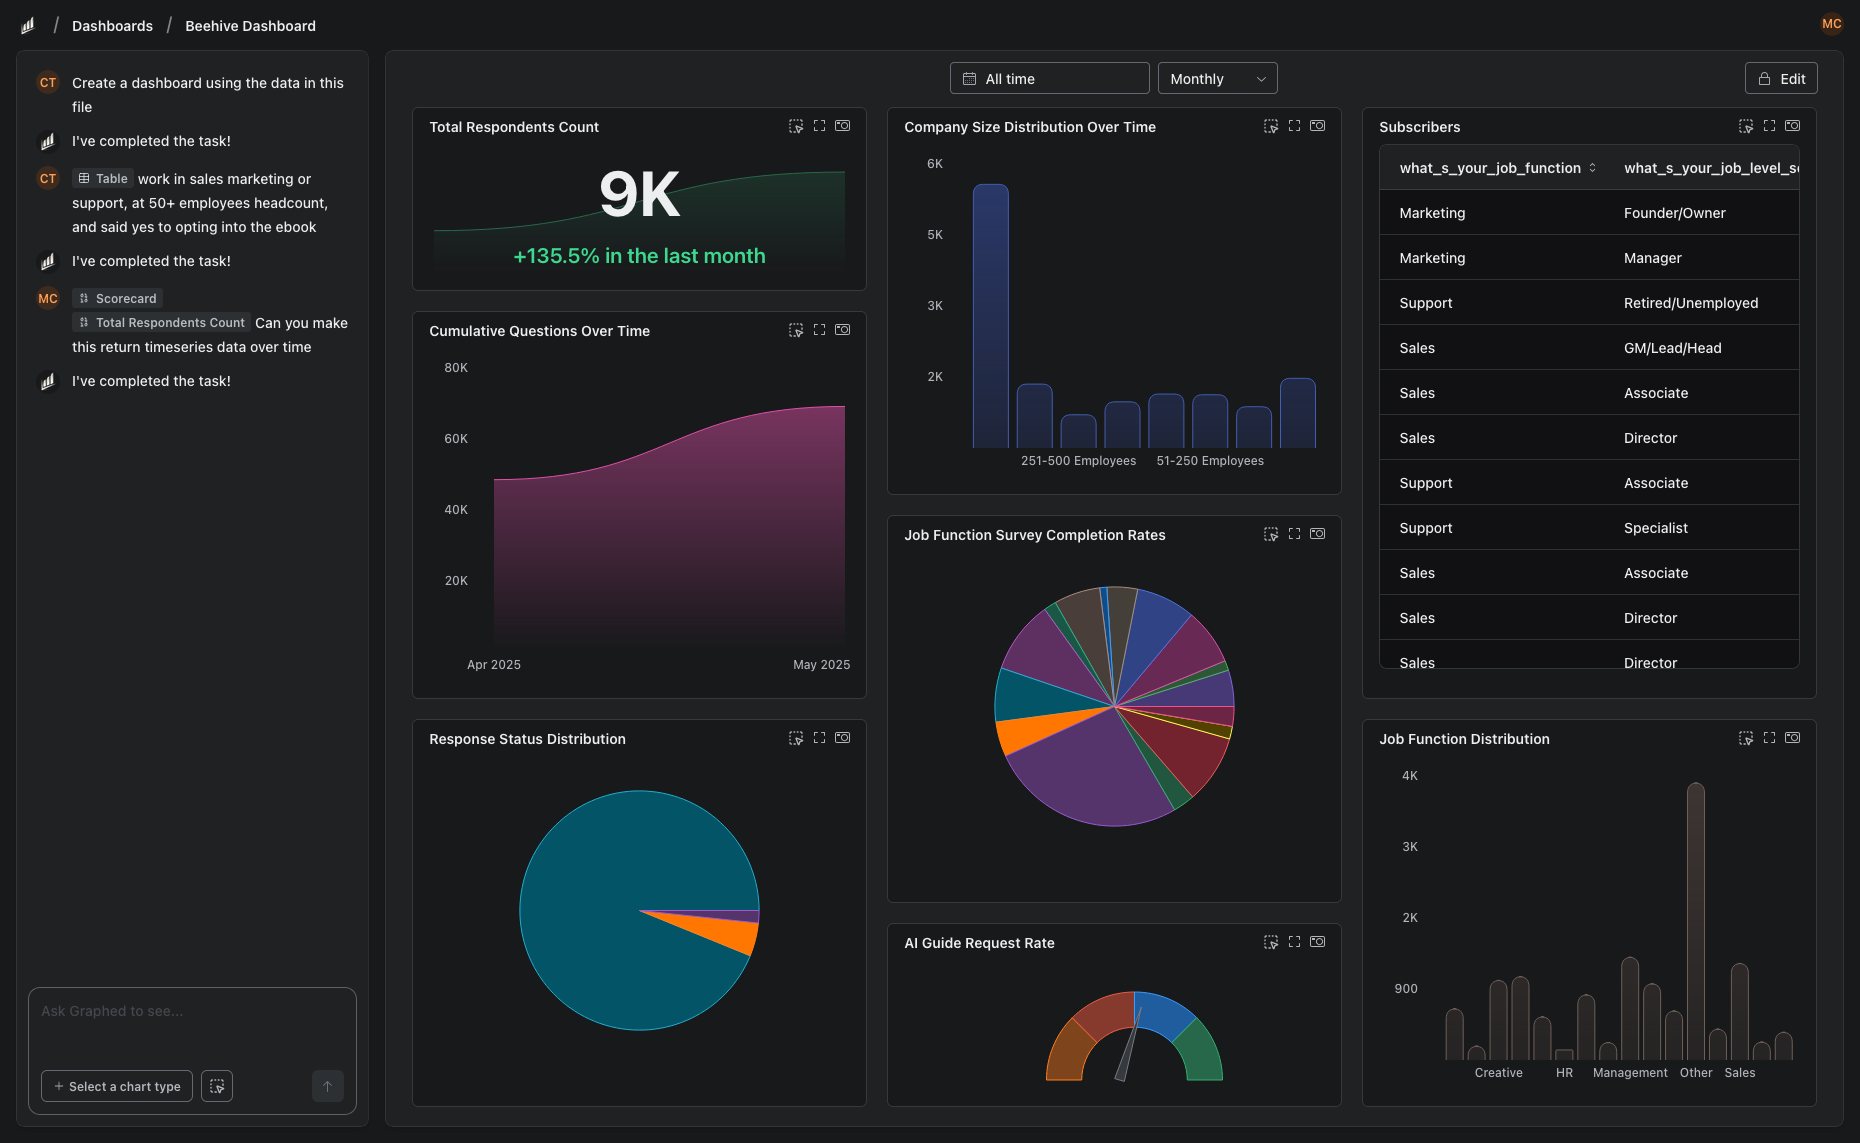
Graphed is an AI data analyst that connects to GA4, Google Ads, Meta Ads, HubSpot, Shopify, Stripe, Salesforce, and 350+ other sources — and builds the dashboards for you. Describe what you want in plain English: "show me organic traffic trends vs paid acquisition cost by channel for the last 90 days." The AI writes the query, pulls the data, and renders the visualization.
No drag-and-drop builder. No calculated fields. No 5-source blending limit. Data syncs hourly, setup takes 15 minutes via OAuth, and your first dashboard is ready within 24 hours. If your Monday morning data wrangling takes longer than it should, this is what Graphed was built for.
The Bottom Line
Google Analytics and Looker Studio are complementary tools, not competitors. GA4 is where your data lives. Looker Studio is how you present it. Most teams need both — but both require manual effort to set up, maintain, and keep relevant as your business evolves.
The real question is not which tool to use. It is how much of your team's time should go into building dashboards versus actually acting on what the data says.
Related Articles
How to Create a Photo Album in Meta Business Suite
How to create a photo album in Meta Business Suite — step-by-step guide to organizing Facebook and Instagram photos into albums for your business page.
Is Google Analytics and Data Analytics the Same?
Is Google Analytics and data analytics the same? No — Google Analytics is one tool, data analytics is the broader discipline. Here is the difference.
What Database Does Tableau Use?
What database does Tableau use? Tableau connects to 100+ databases — it does not store data itself. Learn how live connections and extracts work.