Google Data Studio vs Awesome Table: Dashboard Builder vs Google Sheets Visualizer
Google Data Studio (now Looker Studio) is a full dashboard builder with 1,000+ data connectors. Awesome Table is a lightweight Google Workspace add-on that turns Google Sheets data into interactive tables, charts, and views embedded in Google Sites.
Note: Google rebranded Data Studio to "Looker Studio" in October 2022.
Key Differences
Feature: Price · Google Data Studio: Free · Awesome Table: Free tier; paid from $7/user/month
Feature: Data source · Google Data Studio: 1,000+ connectors · Awesome Table: Google Sheets only
Feature: Visualization · Google Data Studio: Charts, scorecards, maps, tables · Awesome Table: Interactive tables, cards, maps, Gantt
Feature: Embedding · Google Data Studio: iframe in any site · Awesome Table: Native Google Sites integration
Feature: Filters · Google Data Studio: Date ranges, dropdowns, search · Awesome Table: Interactive filters on table data
Feature: Use case · Google Data Studio: Dashboards from any data · Awesome Table: Visualizing Sheets data in Google Sites
Feature: Learning curve · Google Data Studio: Low · Awesome Table: Very low
When to Use Google Data Studio
- Multiple data sources beyond Sheets
- Full dashboard with charts, scorecards, and KPIs
- Scheduled email delivery
- Client-facing reports
When to Use Awesome Table
- Your data lives in Google Sheets and that is enough
- Embedding interactive tables in Google Sites
- Internal directories, inventories, or project trackers
- Simplest possible visualization of spreadsheet data
Alternative: Graphed
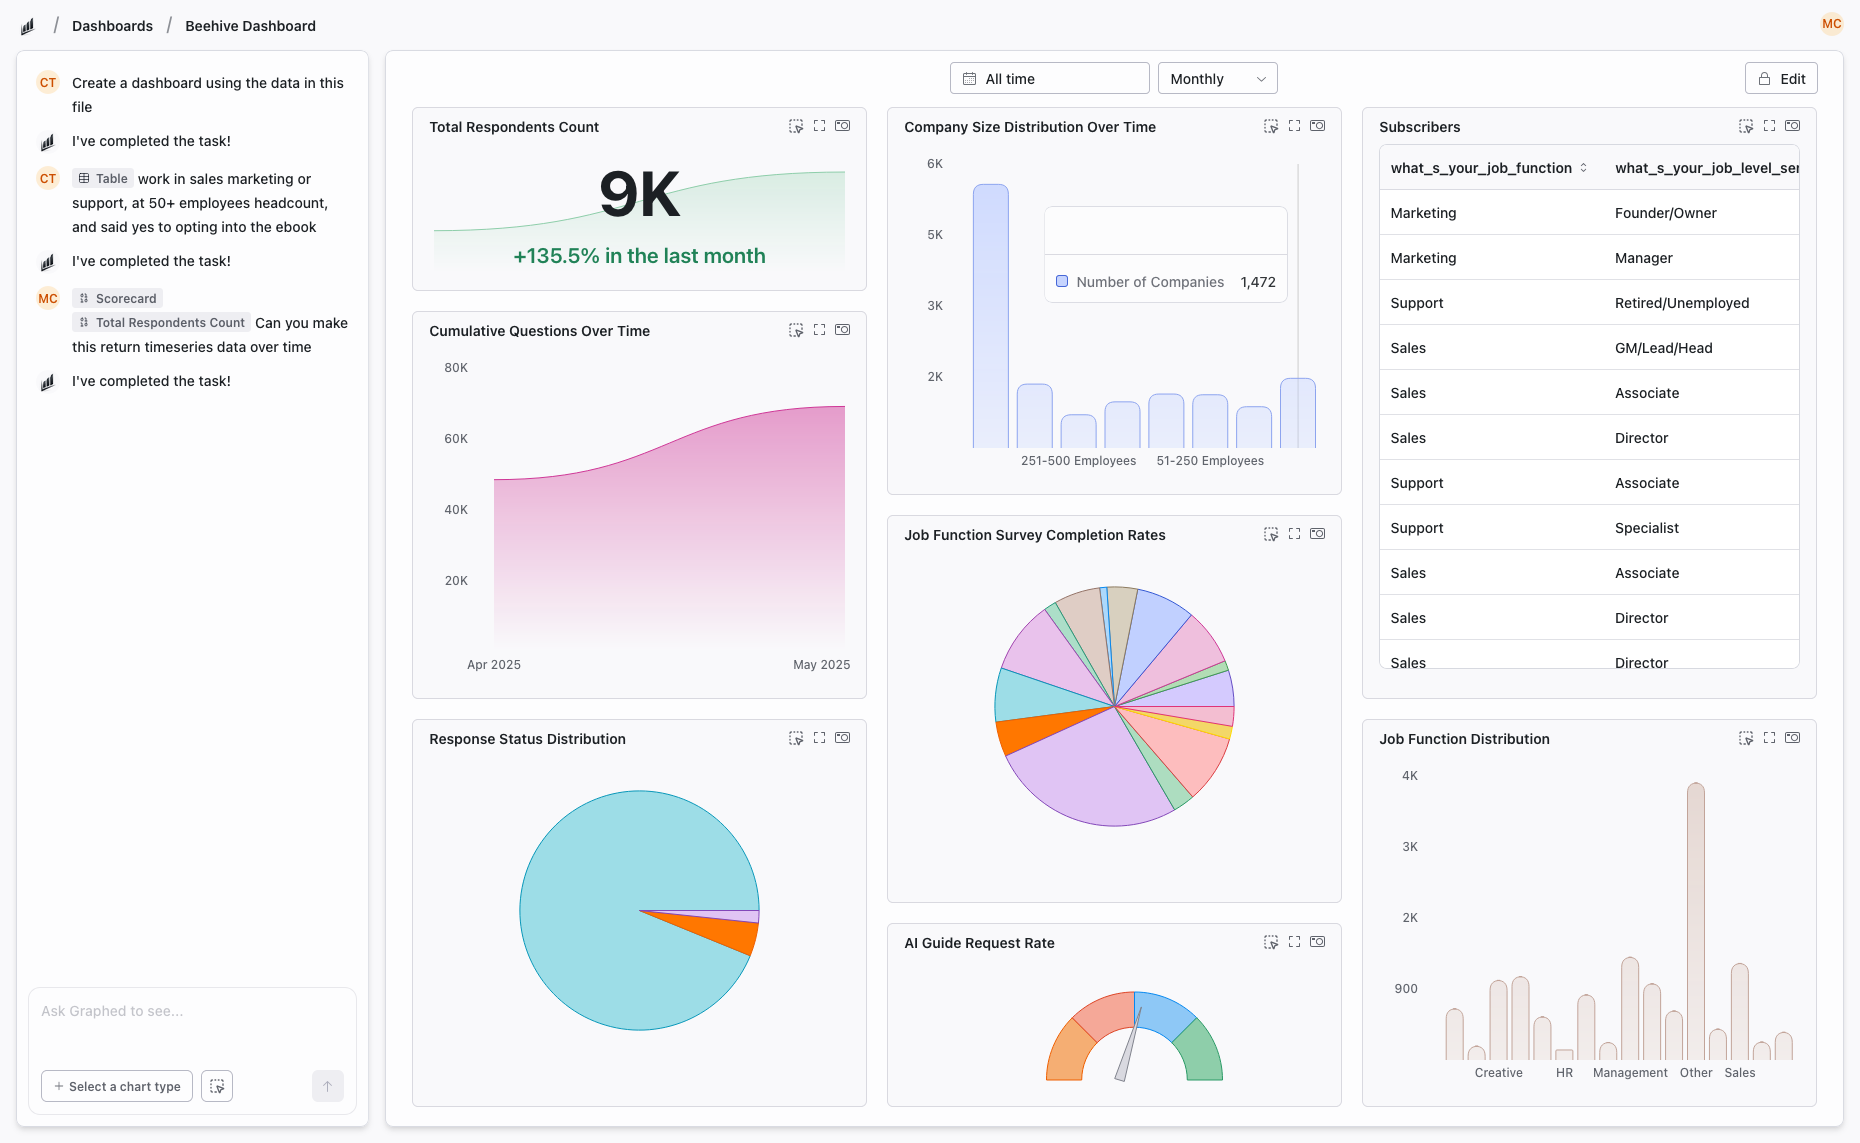
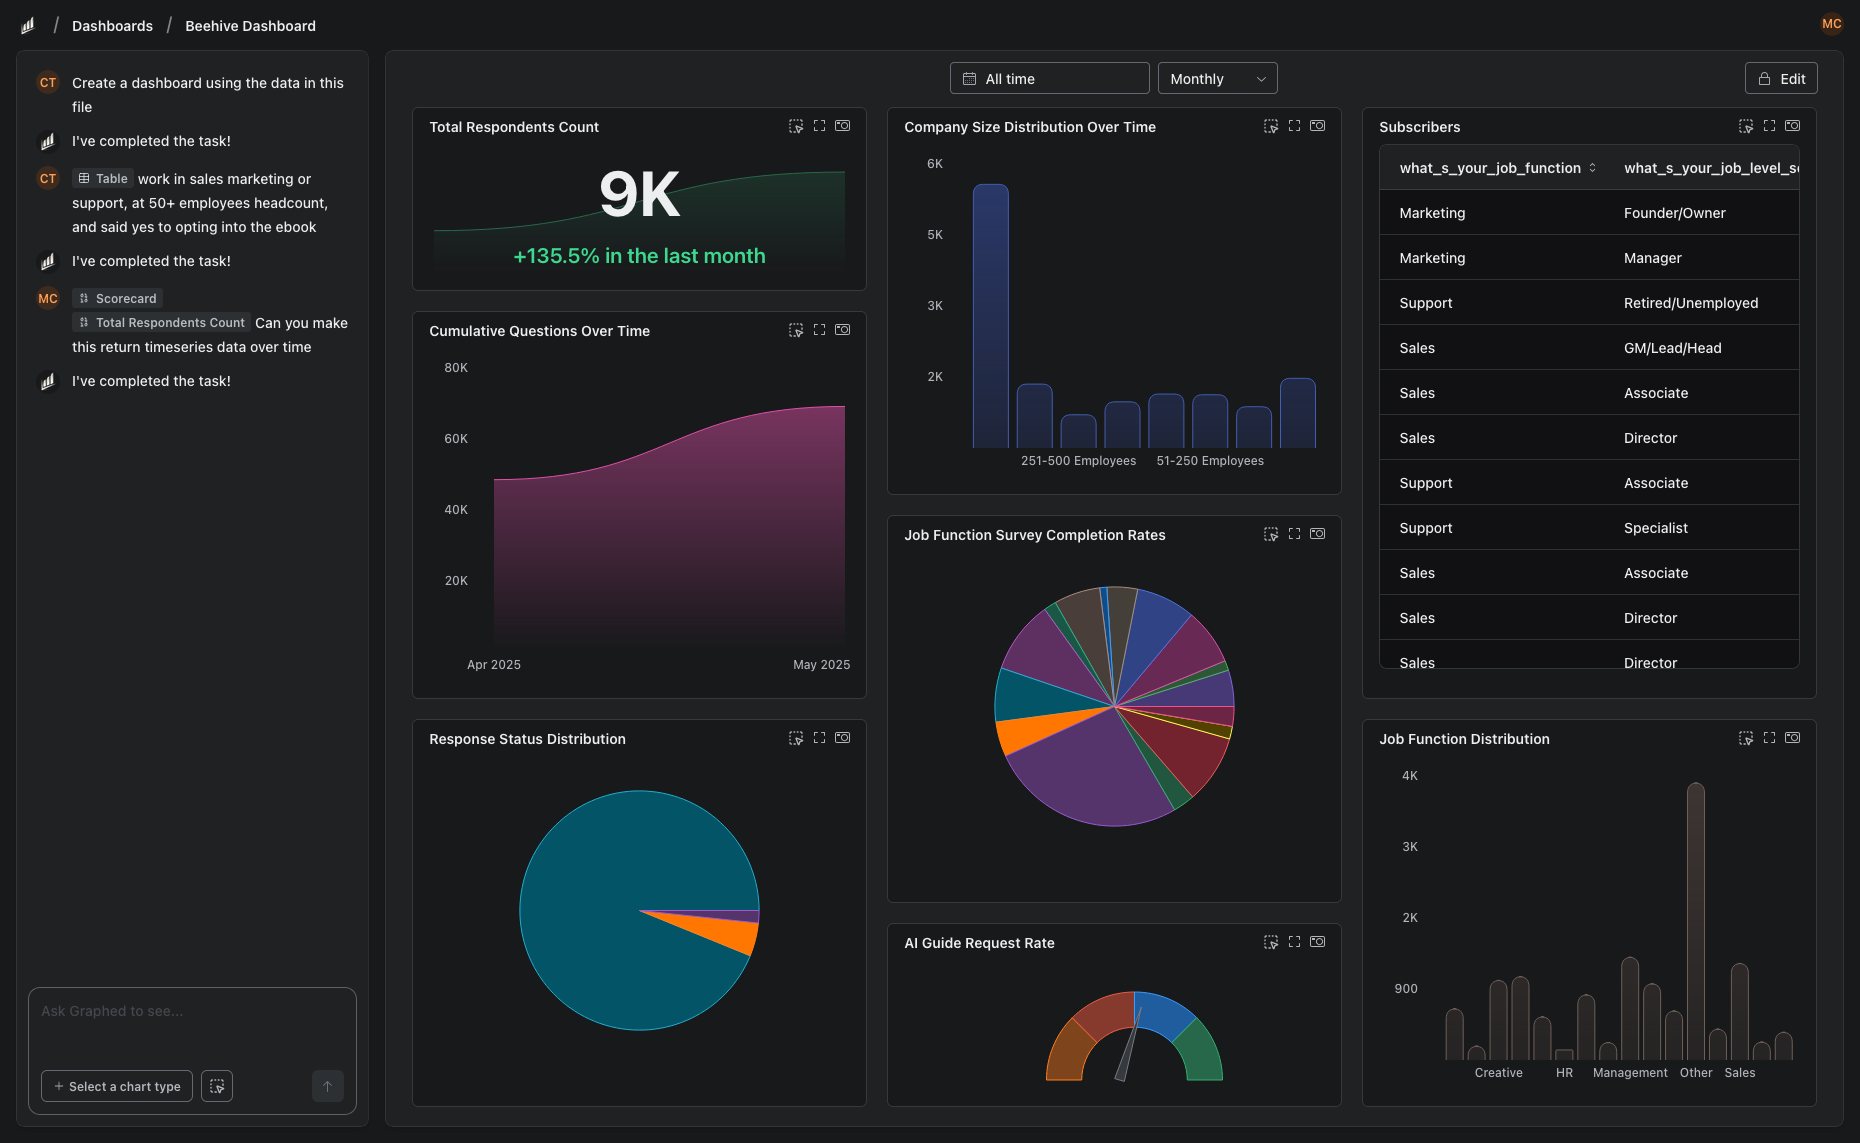
If you need more than either tool offers — live data from 350+ sources, AI-powered analysis, no manual dashboard building — Graphed builds it from natural language. Setup in 15 minutes.
The Bottom Line
Data Studio for full dashboards from any data source. Awesome Table for quick Sheets visualization in Google Sites. Awesome Table is a Google Workspace add-on, not a BI tool — use it for simple internal views, not analytics.
Related Articles
How to Create a Photo Album in Meta Business Suite
How to create a photo album in Meta Business Suite — step-by-step guide to organizing Facebook and Instagram photos into albums for your business page.
Is Google Analytics and Data Analytics the Same?
Is Google Analytics and data analytics the same? No — Google Analytics is one tool, data analytics is the broader discipline. Here is the difference.
What Database Does Tableau Use?
What database does Tableau use? Tableau connects to 100+ databases — it does not store data itself. Learn how live connections and extracts work.